Environmental Infographics in Honor of Earth Day
In honor of Earth Day this past weekend, here are a few environmental infographics courtesy of GOOD. Infographic: Why Don’t Americans Recycle?.Just half of Americans recycle daily, and 13 percent don’t recycle at all. Most people recognize the benefits of recycling, but they’re often not sure which items can be recycled and find the process […]
Infographic Design Rules
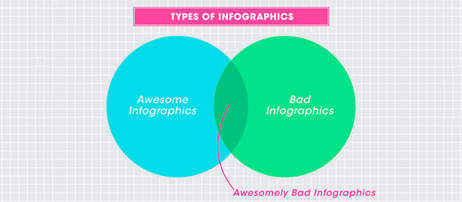
Lately, I’ve come across quite a few articles about infographic design — determining whether or not it is overused and discussing proper usage. Here are two articles and my favorite takeaways: The Do’s And Don’ts Of Infographic Design from Smashing Magazine. Show, Don’t Tell — A rule of cinema is to show, don’t tell. The […]
Texting While Driving Infographics
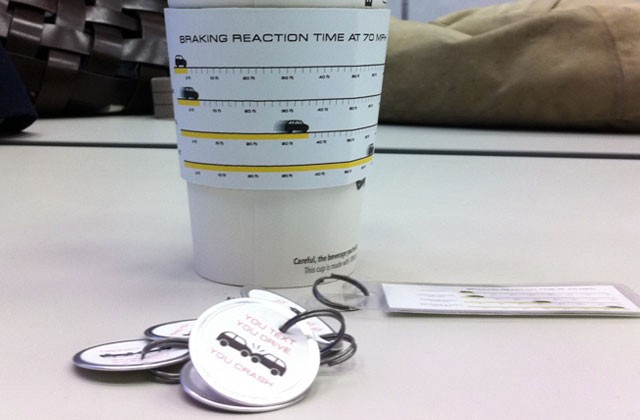
Idea Visualization The first phase of this research project involved collecting various statistics related to texting while driving. After recognizing patterns in the data, our team classified the information into semantically appropriate visual models that show relationships with multivariate data. These visual models were presented in a poster.
Sir Ken Robinson + RSA Animate
This is a great visualization of Sir Ken Robinson’s TED Talk from my previous post Bring on the Learning Revolution!
Idea Visualization: sketch vs. prototype
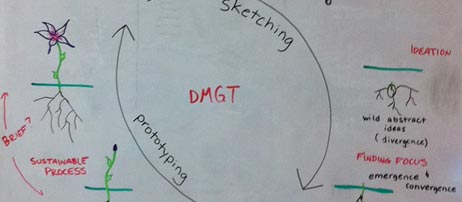
So far in all my classes, professors have constantly said things like “just idea viz it up!” My internal response was always something like, “what the hell does that even mean?!” So, here it is – my first group attempt at really idea vizzing it up!
